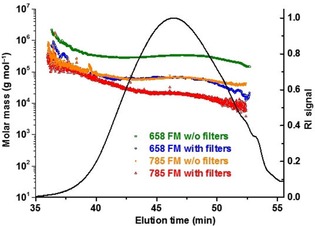
Figure 4.

Molar mass vs. elution time plots of a kraft lignin (Indulin AT) measured with different MALS systems: MALS at 658 nm without filters (green), MALS at 658 nm equipped with fluorescence filters (blue), MALS with an infrared laser at 785 nm without filters (orange), and MALS at 785 nm with filters (red). The RI chromatogram is shown as an overlay (black curve).
