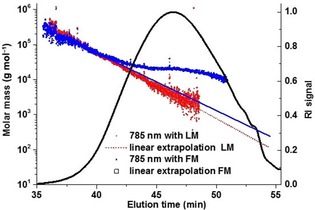
Figure 5.

Molar mass distribution of a kraft lignin (Indulin AT) measured on a MALS with an infrared laser (785 nm) with LM and FM. Additional correction by extrapolation from the high molar mass region was applied to both methods, LM measurement (dotted line) and FM measurement (solid line). The RI chromatogram is shown as an overlay (black curve).
