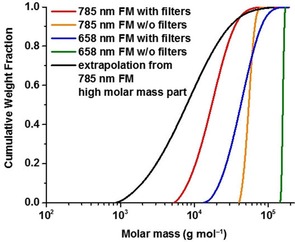
Figure 6.

Cumulative molar mass distribution plots of Indulin AT measured with different MALS systems: 658 nm without filters (green), at 658 nm equipped with fluorescence filters (blue), at 785 nm without filters (orange), and at 785 nm with filters (red), and MALS at 785 nm with filters, FM and extrapolation according to Figure 4 (black). The molar mass averages from extrapolated data are shown in Table 2.
