
Figure 3.
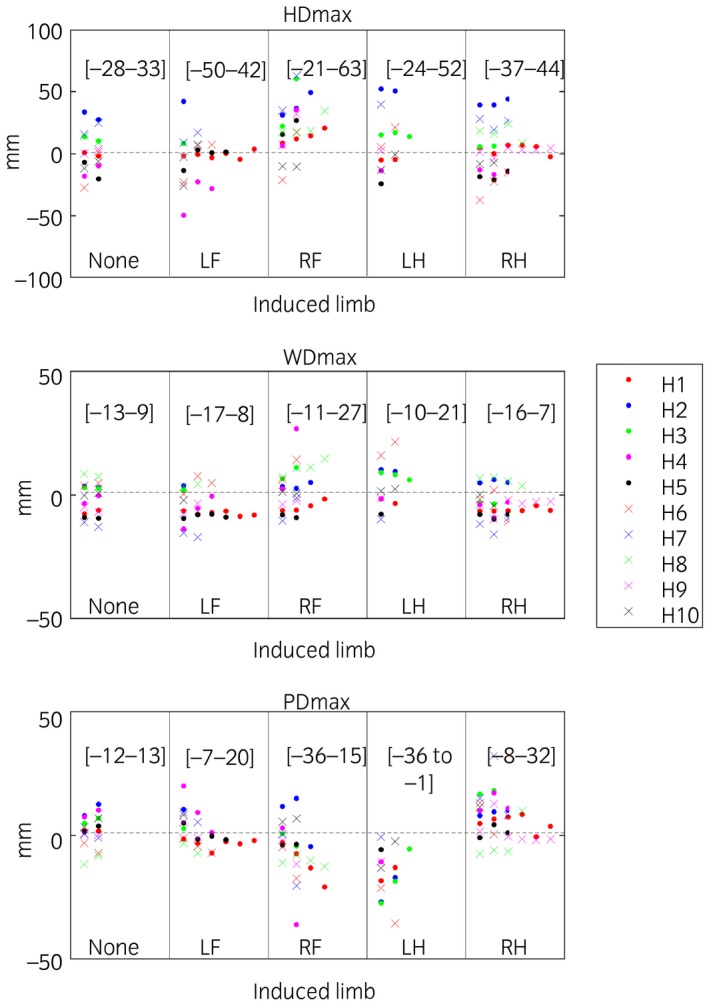
Descriptive plots of mean values per trial for difference between the two position maxima per stride of the head (HDmax), withers (WDmax) and pelvis (PDmax). The highest and lowest trial values for each induction are presented within brackets. Lameness was induced in 10 horses (H1–H10), with 1–7 inductions included per limb, where ‘None’ denotes trials before induction and left fore (LF), right fore (RF), left hind (LH) and right hind (RH) denotes the limb induced. A few outliers are hidden as seen from the values of the [ranges] for each parameter and induction.