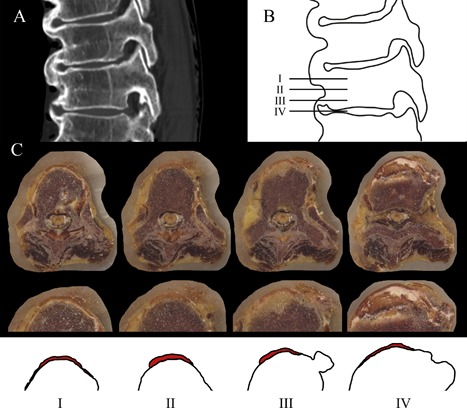
Figure 2.

Example of the selected levels for segmentation of the ALL. In (A), the sagittal CT scan of vertebral bodies T9 to T11 is shown of a 93‐year‐old woman with bridging. In illustration (B), the horizontal lines represent the levels that were selected for segmentation of the ALL: at the level of the vertebral body adjacent to the cranial endplate (I), at the mid‐vertebral level (II) and adjacent to the caudal endplate (III) and at the level of the intervertebral disc (IV). In (C), the cryomacrotome images are shown at four levels of T8 and the T8‐9 intervertebral disc from a 92‐year‐old woman with magnification and illustration of the location of the ALL (in red). The new bone starts to appear at the level near the caudal endplate and is clearly present at the level of the intervertebral disc. CT, computed tomography; ALL, anterior longitudinal ligament.
