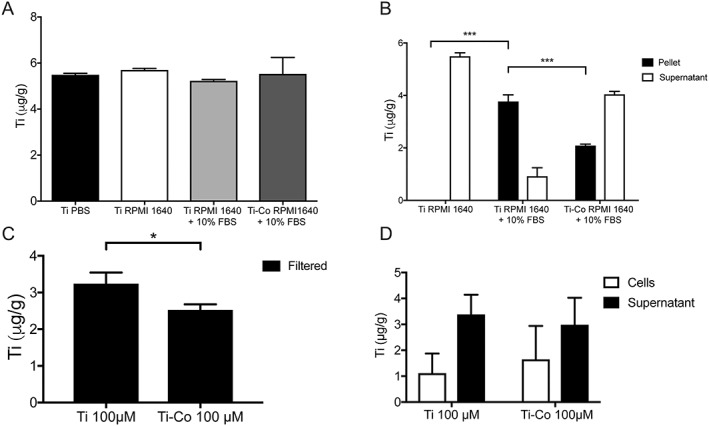
Figure 2.

ICP‐AES analysis of Ti (µg/g) content. Mean *p < 0.05, ***p < 0.001. (A) Ti content after culture in different media. No differences are found among the tested groups (mean of 3 samples/group) (p = 0.5). (B) Ti content in pellet (n = 3) and supernatant (n = 3) after culture in different media. (C) Ti content in solution after culture without (n = 3) or with Co (n = 3) and filtration through a 0.22‐µm sterile filter. (D) Ti content in lysed cells and supernatant after 24‐h exposure to Ti (n = 12) or Ti + Co (n = 12), both suspended in RPMI 1640 + 10% FBS. No differences in Ti content in cells (p = 0.5) or supernatant (p = 0.7) are found.
