
Figure 3.
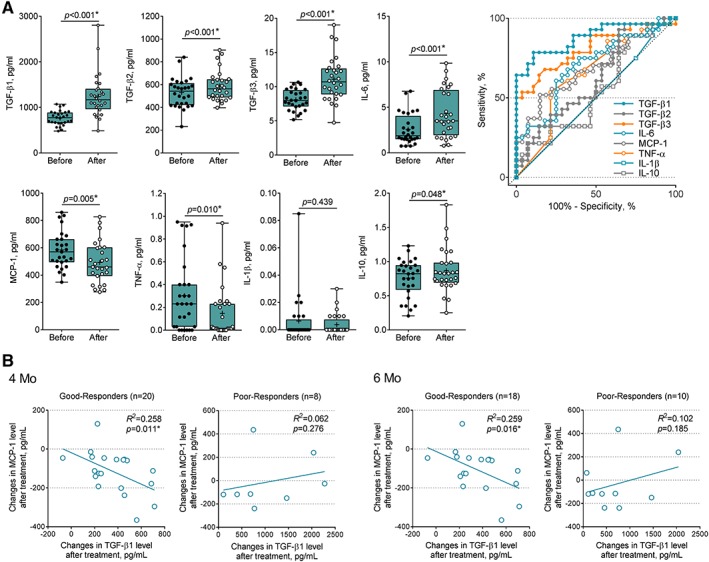
Changing patterns of cerebrospinal fluid (CSF) cytokine levels in the mesenchymal stem cell (MSC) treatment group. (A) Comparison of cytokine levels in CSF from patients before and after MSC treatment. Median and first and third quartiles (black bars) are shown, and each dot (black dot, before treatment; white dot, after treatment) represents individual data. Probability values were calculated using paired t test. Receiver operating characteristic analyses of individual cytokines compare before versus after MSC treatment in the test cohort. (B) Subgroup analysis in good responders and poor responders after MSC treatment. Correlation is shown between changes of transforming growth factor (TGF)‐β1 and monocyte chemoattractant protein (MCP)‐1 by MSC treatment in good responders at 4 and at 6 months; black lines indicate R 2. After MSC treatment, participants with ≥50% improvement in Amyotrophic Lateral Sclerosis Functional Rating Scale–Revised slope were defined as good responders and those with <50% improvement were defined as poor responders. *Statistically significant. TNF = tumor necrosis factor.