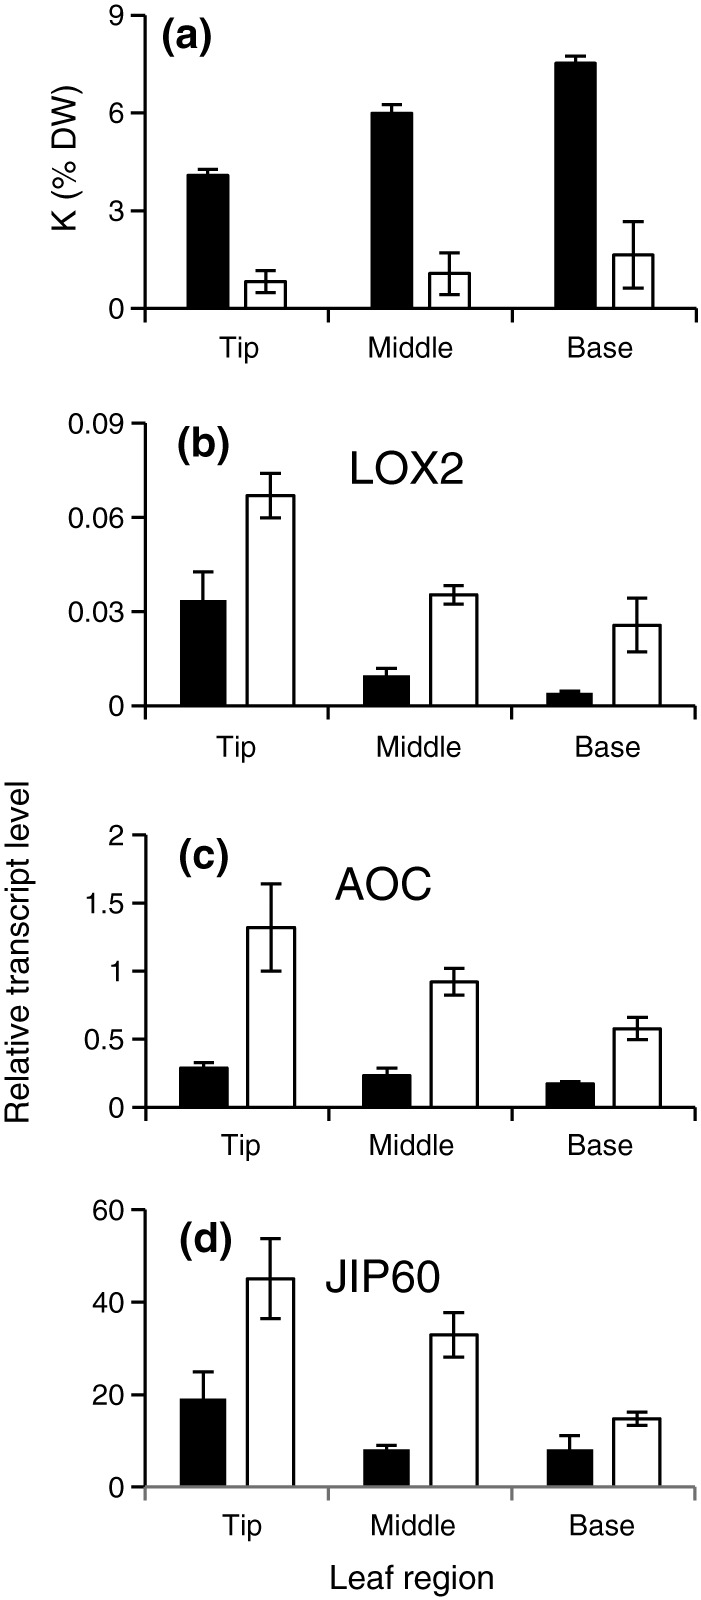
Figure 3.

K concentration and transcript levels of JA‐related genes within leaves of barley plants grown in control or −K media. Potassium concentration (a) and relative transcript levels of HvLOX2 (b), HvAOC (c), and HvJIP60 (d) in different zones of the second leaf of barley plants grown for 14 days in control (black bars) or −K (open bars) media. Corresponding leaf segments from six plants were pooled for each sample, and the mean (±SE) of three independently grown and treated batches of plants is shown. α‐TUB was used as reference gene
