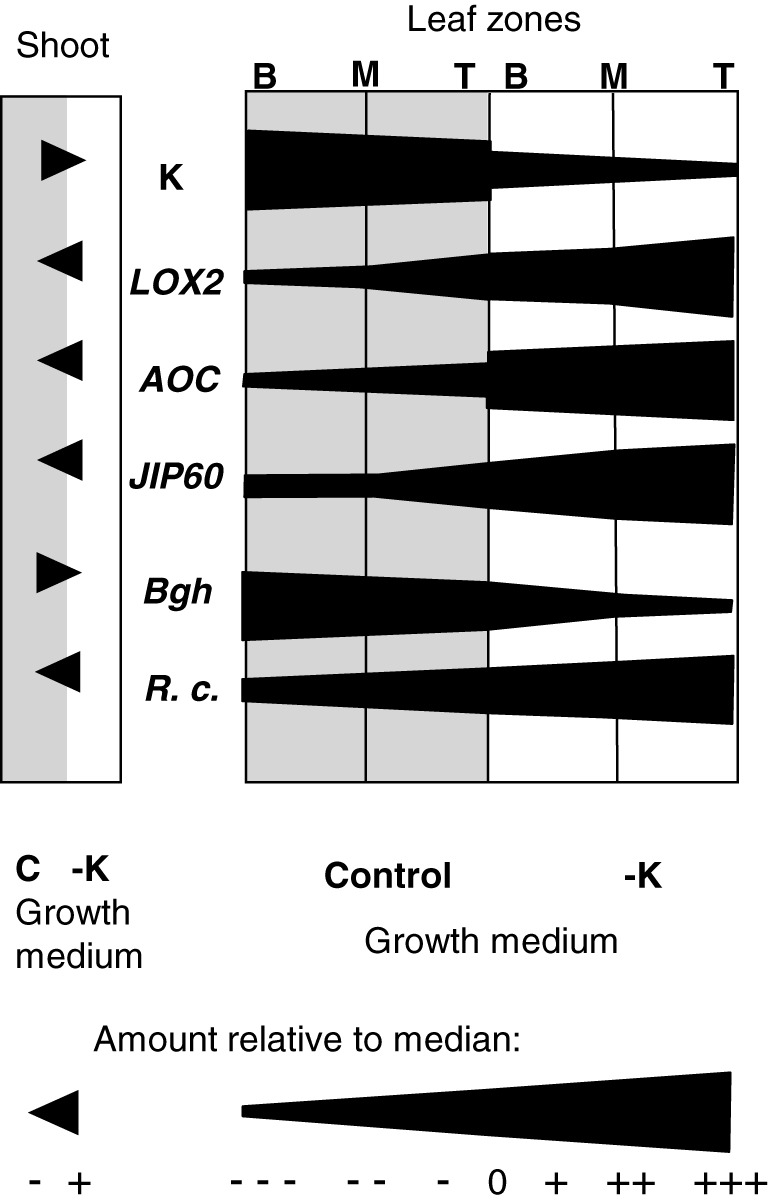
Figure 7.

Gradients in tissue K concentration, transcript levels, and disease symptoms across leaf zones and K treatments. Semiquantitative representation of tissue K concentrations (K), transcript levels of JA‐related genes (HvLOX2, HvAOC, HvJIP60) and disease symptoms of Blumeria graminis (Bgh) and Rhynchosporium commune (R. c.) in whole shoots (left) as well as base (B), middle (M), and tip (T) regions of the second leaves of plants grown in control (grey background) or −K (white background) media. To build the profiles, measured values were classified into two levels (+, −) for whole shoots or into seven levels for leaf segments, ranging from much lower (−−−) to much higher (+++) than the median (0) across all samples (see scale bar). If amounts differed between adjacent segments, a continuous gradient within the segments was assumed
