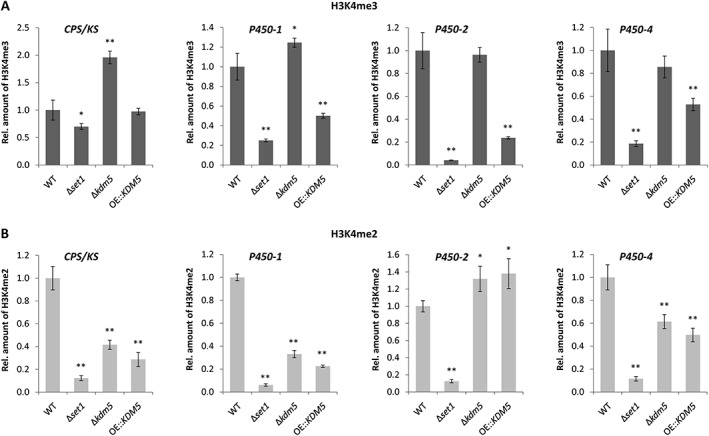
Figure 5.

H3K4me3 and H3K4me2 levels at gibberellic acid (GA) cluster genes in Δset1, Δkdm5 and OE::KDM5 mutants. Indicated strains were grown in liquid culture (ICI + 6 mM Gln) for 3 days prior to ChIP‐qPCR using the (A) H3K4me3 or (B) H3K4me2 antibody. Therefore, the enriched samples (precipitated by antibody) were normalized to the respective input samples (initially applied chromatin). The WT was arbitrarily set to 1, and the data are mean values ± SD (n = 4). For statistical analysis, the mutants were compared with the WT using the student's t‐test: *, p < 0.05; **, p < 0.01.
