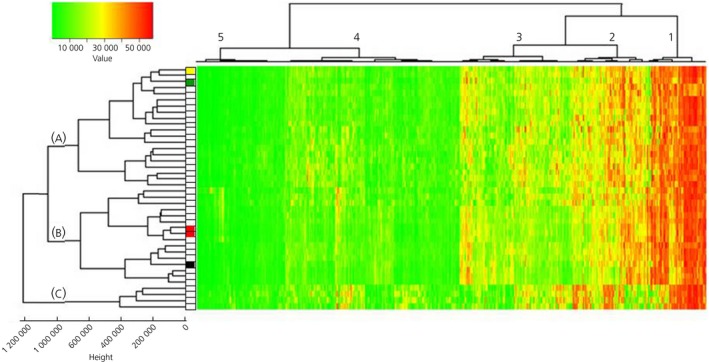
Figure 1.

Unsupervised clustering of 1259 significantly expressed genes. Colour coding of gene expression values is shown in the upper left corner. USP8 mutation status is indicated to the left of the heatmap: white squares identify wild‐type sequence, whereas coloured squares indicate USP8 variants: red, variant c.2159C>G; green, variant c.2152T>C; black, variant c.2155_2157delTCC; yellow, variant c.2157_2171delCCCAGATATAACCCA. Height of nodes represents dissimilarity between clusters as measured by Euclidean distance
