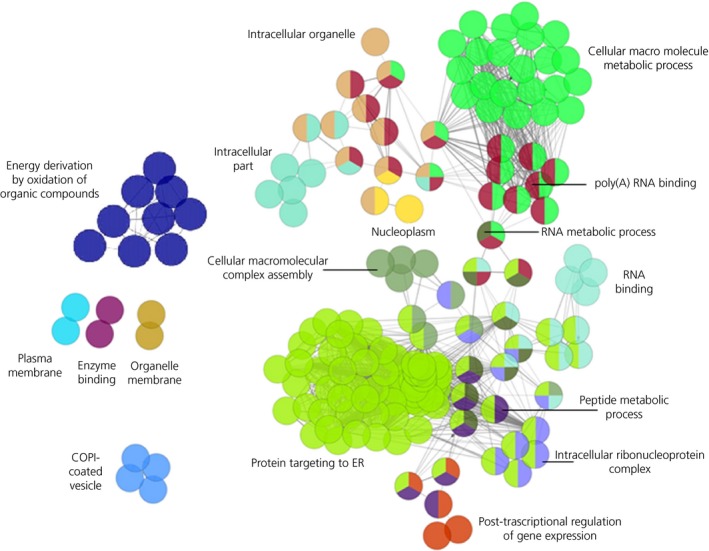
Figure 2.

cytoscape analysis showing networks formed by principal significant terms. The number of nodes is proportional to the number of the term‐forming genes; nodes are colour‐coded according to functional annotations and can have more than 1 colour because genes may belong to more than 1 term. The 2 major terms are shown in bold. COPI, coat protein I; ER, endoplasmic reticulum
