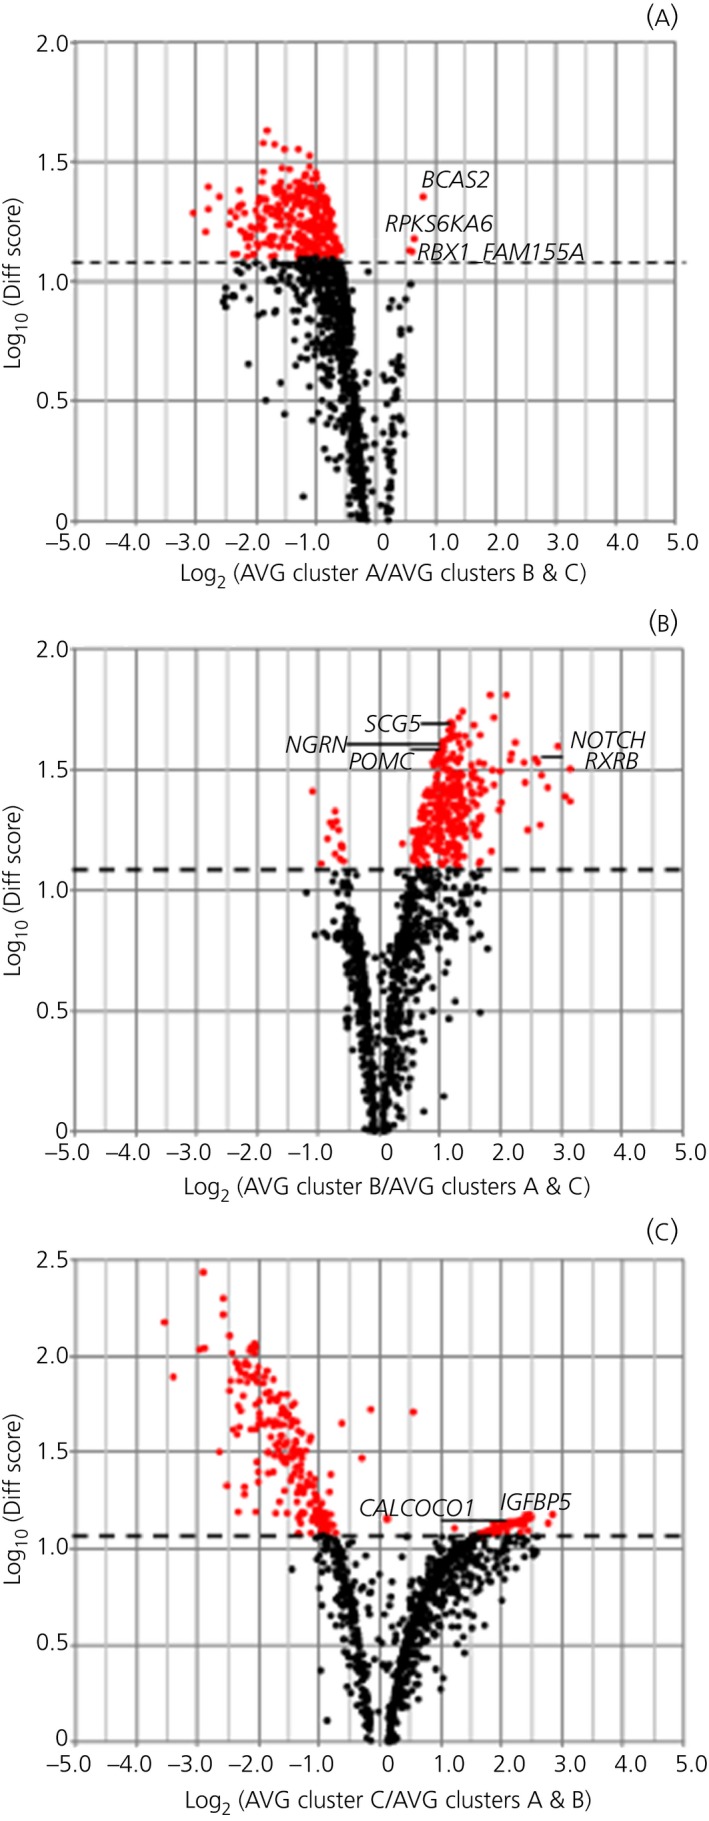
Figure 3.

Volcano plot. Genes up‐ and down‐regulated in the 3 clusters. Effect (average signal, AVG) is shown on the x‐axis and significance (Diff Score) is shown on the y‐axis. Up‐regulated genes appear to the right and down‐regulated genes appear to the left of the x‐axis. (A) Comparison between cluster A and clusters B and C. (B) Comparison between cluster A and clusters A and C. (C) Comparison between cluster C and clusters A and B. Significant genes are highlighted in red (Diff Score >13) and selected genes are identified by name
