Figure 4.

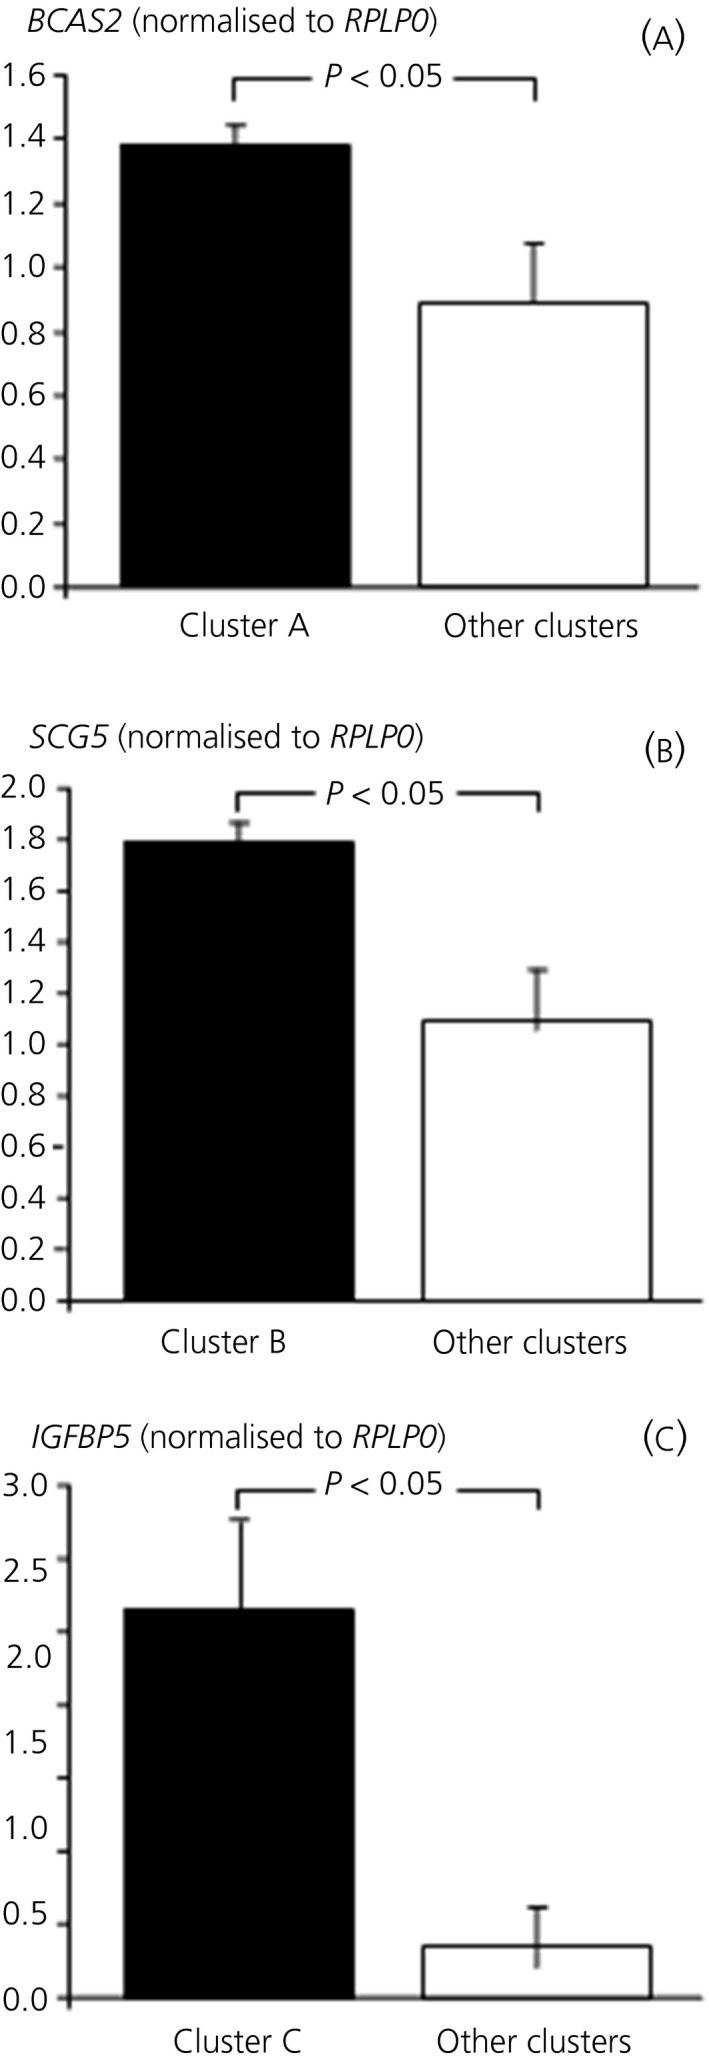
Quantitative expression of selected genes in different clusters. (A) Expression of BCAS2 in cluster A vs other clusters. (B) Expression of SCG5 in cluster B vs other clusters. (C) Expression of IGFBP5 in cluster C vs other clusters

Quantitative expression of selected genes in different clusters. (A) Expression of BCAS2 in cluster A vs other clusters. (B) Expression of SCG5 in cluster B vs other clusters. (C) Expression of IGFBP5 in cluster C vs other clusters