Figure 2.

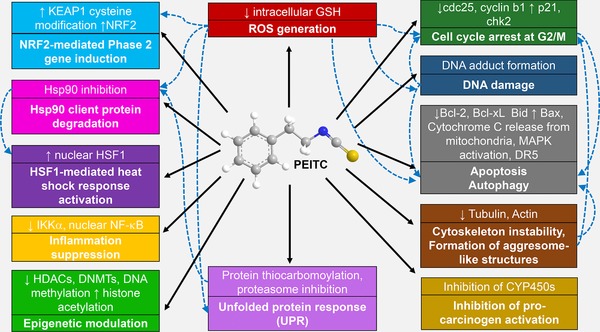
Cellular processes and pathways that are induced by PEITC (represented by the solid arrows). The dashed arrows represent the downstream effects/pathways induced as a consequence.

Cellular processes and pathways that are induced by PEITC (represented by the solid arrows). The dashed arrows represent the downstream effects/pathways induced as a consequence.