
Figure 2.
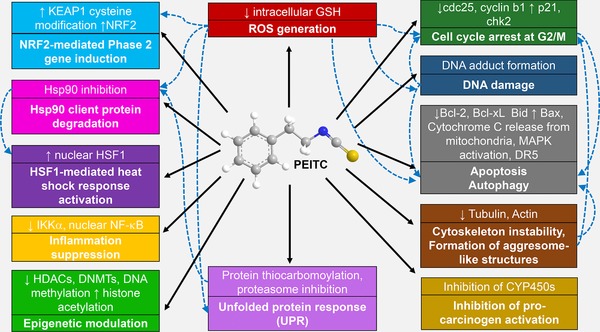
Cellular processes and pathways that are induced by PEITC (represented by the solid arrows). The dashed arrows represent the downstream effects/pathways induced as a consequence.
Official websites use .gov
A
.gov website belongs to an official
government organization in the United States.
Secure .gov websites use HTTPS
A lock (
) or https:// means you've safely
connected to the .gov website. Share sensitive
information only on official, secure websites.
Cellular processes and pathways that are induced by PEITC (represented by the solid arrows). The dashed arrows represent the downstream effects/pathways induced as a consequence.