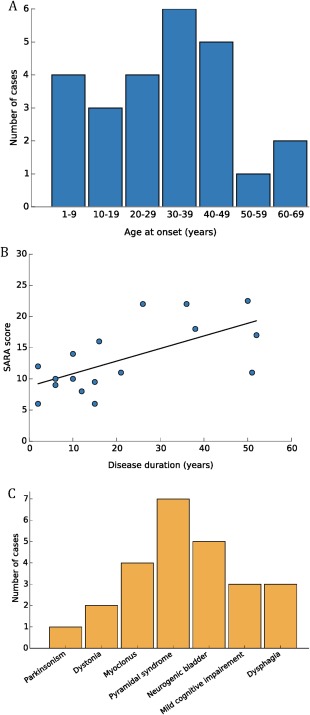
Figure 3.

Genotype‐phenotype correlations in spinocerebellar ataxia type 14 (SCA14). (A) Age of onset in an SCA14 cohort. (B) Correlation between Scale for Assessment and Rating of Ataxia (SARA) score and disease duration. (C) Complex phenotypes in SCA14. [Color figure can be viewed at http://wileyonlinelibrary.com]
