
Figure 5.
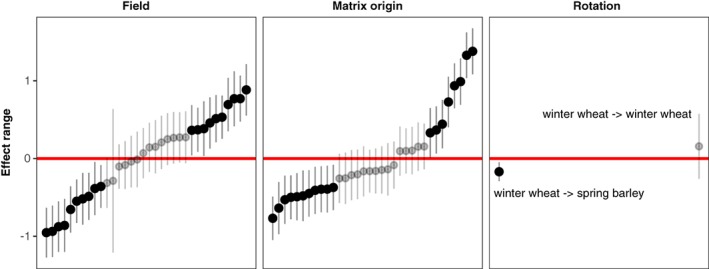
Analysis of the sources of variation in modelled outcomes of population dynamics. We generated models for each of 34 fields, 22 of which were maintained in winter wheat, 12 rotated from winter wheat to spring barley. We applied each model to the initial density state. The response variable was change in population size and we used a linear mixed model to estimate variance components due to three sources: ‘Field’, the initial state in each field; ‘Matrix origin’ the location from which the transition matrix model was estimated; and ‘Rotation’ the sequence of crops from one year to the next. The effect range is the estimate of the random effect for each field, location or rotation. We used a parametric bootstrap to estimate confidence intervals. Grey points have confidence intervals that overlap zero.