
Figure 2.
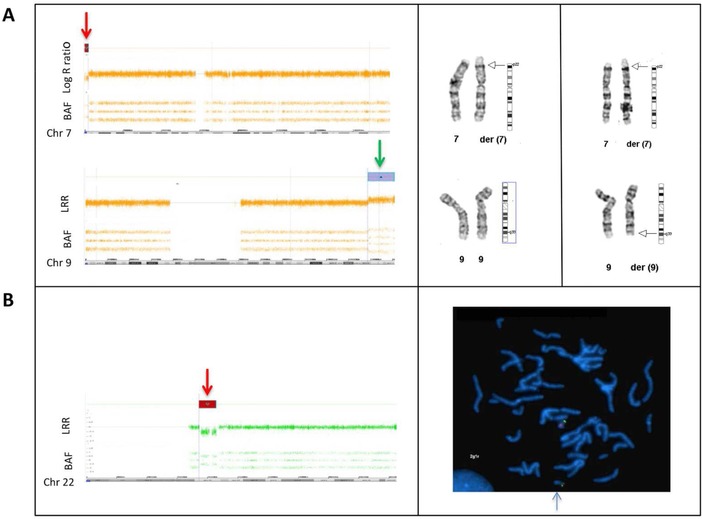
Further characterization of XHMM results by additional (cyto‐) genetic testing. BAF, B allele frequency; Chr, chromosome; der, derivate chromosome; LLR, log R ratio; FISH, fluorescence in situ hybridization. A, SNP array profile of chromosomes 7 and 9 are shown on the left. The top plot of each image shows the LRR, which provides an estimation of the copy number for each marker aligned to its chromosomal position. The bottom plot of each image shows the BAF for each SNP aligned to its chromosomal position. SNP array analysis revealed a terminal copy‐number loss at 7p22.3 (2Mb; GRCh37; chr7:43360‐2067625) indicated with a red arrow and a terminal copy‐number gain at 9q33.3–q34.43 (11.8Mb; GRCh37; chr9:129172353–141020389) indicated with a green arrow. Chromosomes 7 and 9 from the index (left) with the unbalanced translocation and the father (right) carrying the balanced translocation are shown on the right. The breakpoints of the reciprocal translocation are indicated with an arrow. The index has the derivative chromosome 7 lacking a short segment from the short arm of chromosome 7 that is replaced by an extra copy of a terminal segment of chromosome 9q. The father has two derivative chromosomes 7 and 9, each carrying a segment of the other chromosome. B, SNP array profile of chromosome 22 is shown on the left. SNP array analysis revealed a copy‐number loss at 22q11.2 (3.2Mb; GRCh37; chr22:20779645_20792061) indicated with a red arrow. The results of metaphase FISH on blood from the mother is presented on the right. The 22q11.2 region is recognized by the HIRA probe, producing a red signal. The green signal is from the ARSA probe hybridizing with the ARSA gene on chromosome band 22q13.33. The 22q11.2 deletion is indicated by a blue arrow. Metaphase FISH analysis revealed that the mother is also a carrier of the 22q11.2 deletion (ish del(22)(q11.2q11.2)(HIRA‐))