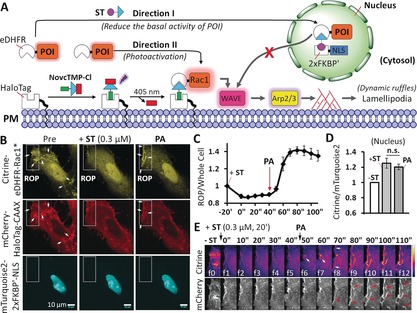
Figure 2.

Parallel MAC of Rac1 in live cells. A) Representation of the principle of the parallel MAC approach. B) Confocal images of a HeLa cell co‐expressing Citrine‐eDHFR‐Rac1* (cytosol), mCherry‐HaloTag‐CAAX (plasma membrane), and mTurquoise2‐2×FKBP′‐NLS (nucleus). The rectangular area indicates the region of photoactivation (ROP) by 405 nm light. Arrows indicate ruffles. Scale bar=10 μm. C) Normalized fluorescence intensity ratio of Citrine‐eDHFR‐Rac1* at the ROP versus the entire cell (n=4 cells). The Citrine‐eDHFR‐Rac1* level in the cytosol decreased after adding 0.3 μm ST, and was then recruited to the ROP upon photoactivation (PA). D) Normalized fluorescence intensity ratio of Citrine‐eDHFR‐Rac1* versus mTurquoise2‐2×FKBP′‐NLS in the nucleus before (−ST) and after the addition of 0.3 μm ST for 20 min (+ST), and after PA. Not significant (n.s.; p=0.46) as determined from a paired Student's t‐test. E) Time series of images of the ROP shows the recruitment of Citrine‐eDHFR‐Rac1* (upper panel, intensity coded) and ruffle formation (arrows) at the plasma membrane (lower panel, mCherry‐HaloTag‐CAAX). For (C) and (D), mean values and the standard error of the mean (SEM) are shown (Supporting Information, Movie S1).
