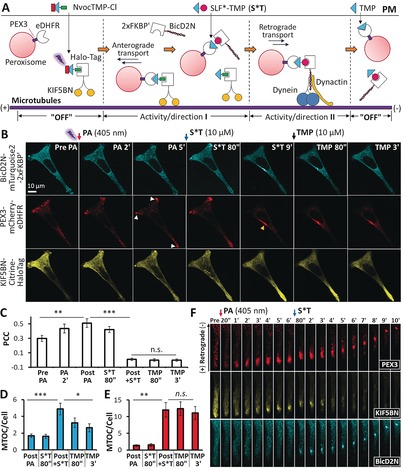
Figure 3.

Competitive MAC of peroxisome transport. A) Representation of the principle of competitive MAC. B) Representative confocal images. Cherry channel: the arrows indicate that peroxisomes cluster at the cell periphery; the arrow head indicates that peroxisomes accumulate at the microtubule organization center (MTOC) at the cell center. C) Pearson's correlation coefficient (PCC) analysis of the colocalization between KIF5BN‐Citrine‐eDHFR and PEX3‐mCherry‐HaloTag showed that KIF5BN is recruited to peroxisomes after PA and then dissociates from peroxisomes after adding S*T. D) The fluorescence intensity ratio of BicD2N at the MTOC versus the entire cell increases after adding S*T and decreases after adding TMP. E) The fluorescence intensity ratio of PEX3 (peroxisome marker) at the MTOC versus the entire cell increases after S*T, but does not change significantly after adding TMP for 3 min. Scale bar=25 μm. For (C), (D), and (E), mean values and SEM are shown; data were based on n=6 cells from three independent experiments; p values are determined by a paired Student's t‐test (***: p<0.001; **: p<0.01; *: p<0.05; n.s.: not significant); “Post PA” indicates 5–10 min after PA and just before adding S*T, while “Post+S*T” means 5–10 min after the addition of S*T and just before adding TMP. F) Time series of an enlarged region within the cell as shown in Figure S11 (Supporting Information; see also Movies S3 and S4).
