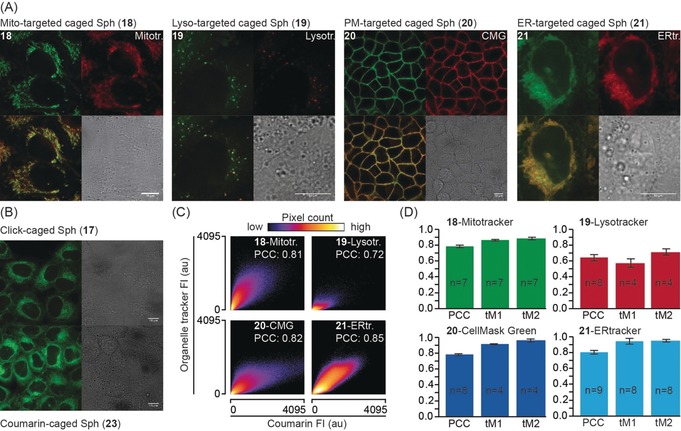
Figure 1.

A) Cellular localization of organelle‐targeted caged sphingosine derivatives. The upper left panels depict the localization of the sphingosine probes 18–21 (left to right for mitochondria‐ (18), lysosome‐ (19), plasma‐membrane‐ (20), and ER‐targeted (21) probes). The upper right panels show the respective organelle markers (left to right: mitotracker green, lysotracker green, cell mask green, ER tracker). The lower left panels show overlays of probe and organelle marker fluorescence while the lower right panels depict the corresponding bright‐field images. B) Cellular localization of click‐caged sphingosine 17 and untargeted diethylaminocoumarin‐caged sphingosine 23. Scale bars: 10 μm in all images. C, D) Quantification of the colocalization between caged compounds and organelle markers. 2D histograms of representative images show correlation between pixel intensities in both channels. Source images for the 2D histograms are displayed in Figure S5. Bar graphs show Pearson correlation coefficients (PCC) of non‐thresholded images and Manders correlation coefficients above the autothreshold for both channels, in every case derived from a minimum of four images. Only images that could be thresholded using a standardized automated routine were included for the determination of Manders overlap coefficients to avoid human bias. Error bars indicate standard deviation.
