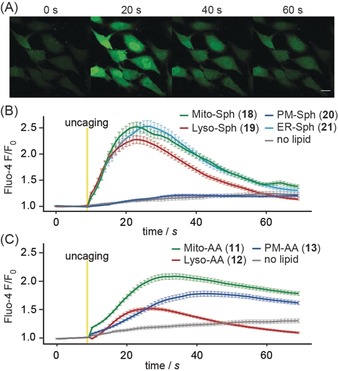
Figure 2.

A) Time lapse montage of Fluo‐4 responses after uncaging of sphingosine from the mitochondria‐targeted probe 18. Scale bar: 20 μm. B, C) Mean normalized Fluo‐4 intensities after uncaging of sphingosine (B) and arachidonic acid (C) from probes 11–13 and 18–21. Error bars represent SEM, yellow bars indicate uncaging events.
