Figure 1.

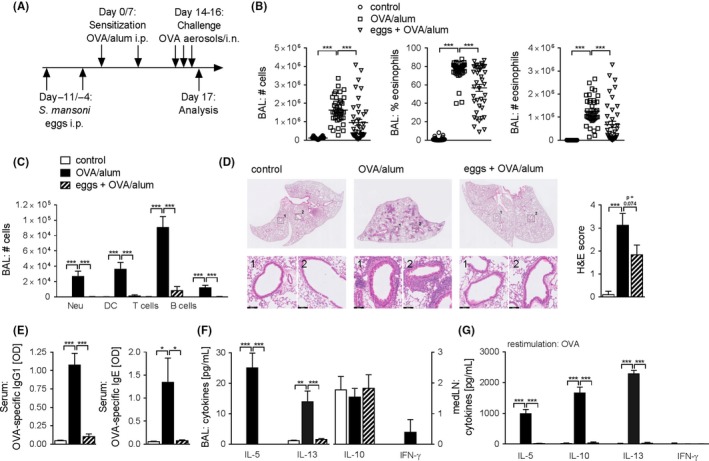
Schistosoma mansoni eggs protect against OVA/alum‐induced AAI. A, Schematic representation of the experimental model. B, Total number of cells, percentage of eosinophils and total number of eosinophils in BAL fluid as assessed by FACS. Summary of multiple experiments. C, Total number of neutrophils (Neu), dendritic cells (DC), T cells and B cells in BAL fluid as assessed by FACS. Representative of multiple experiments, n = 4‐5. D, Representative images of haematoxylin and eosin (H&E) histology staining from PFA‐fixed sections (scale bar = 100 μm). Scores for severity of cellular infiltration around the airways on a scale of 0‐4 were assessed by two blinded observers. The average of both scores is displayed. Significant difference was determined by unpaired t test, *P < 0.05. E, OVA‐specific IgG1 and OVA‐specific IgE antibodies in serum measured by ELISA. Representative of multiple experiments, n = 4‐5. F, Cytokine concentration in BAL fluid measured by CBA. Representative of multiple experiments, n = 4‐5. G, Cytokine concentration in medLN cell supernatants after 4 d restimulation with OVA (10 μg/mL) measured by CBA. Representative of multiple experiments, n = 4‐5. Significant differences were determined by two‐way ANOVA following Tukey's multiple comparison test (B) or one‐way ANOVA following Dunnett's multiple comparisons test (C‐F) and are indicated with *P < 0.05, **P < 0.01, ***P < 0.001
