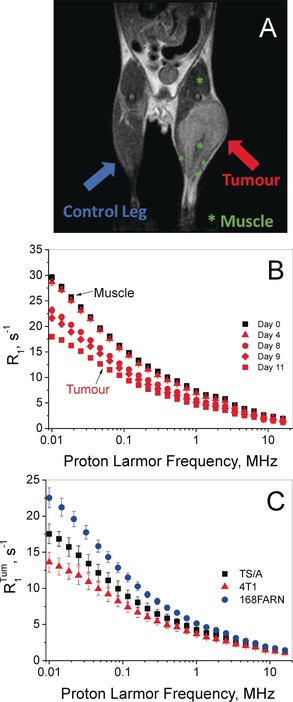
Figure 2.

A) T 2‐weighted MRI of the tumour‐bearing mouse (4T1 graft). B) 1/T 1 NMRD profile of a mouse leg tissue before (day 0) and after the intramuscular injection of one million 4T1 cells. C) NMRD profiles of the tumour tissues grown on hind limbs: 4T1 (▴), TS/A (▪), and 168FARN (•) acquired 11±2, 13±3, and 25±1 days after intramuscular injection, respectively. R 1 tum is the averaged relaxation rate normalized to the tumour mass fraction compared to the whole hind limb. Error bars report the standard deviation (SD).
