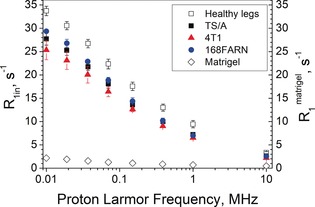
Figure 4.

R 1in of mouse leg tissue: healthy legs and tumour‐bearing legs. Values were obtained from the NMRD data by fitting to the 2SX model. For comparison, the R 1 values measured for Matrigel are reported (◊). Error bars indicate SDs from at least five independent experiments.
