Figure 6.

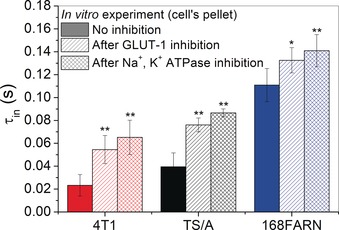
τ in values determined “in vitro” on cells with and without GLUT‐1 and Na+/K+ ATPase inhibition. Errors bars indicate SDs from at least four independent experiments. *P<0.05; **P<0.01; Student's t‐test.

τ in values determined “in vitro” on cells with and without GLUT‐1 and Na+/K+ ATPase inhibition. Errors bars indicate SDs from at least four independent experiments. *P<0.05; **P<0.01; Student's t‐test.