
Figure 4.
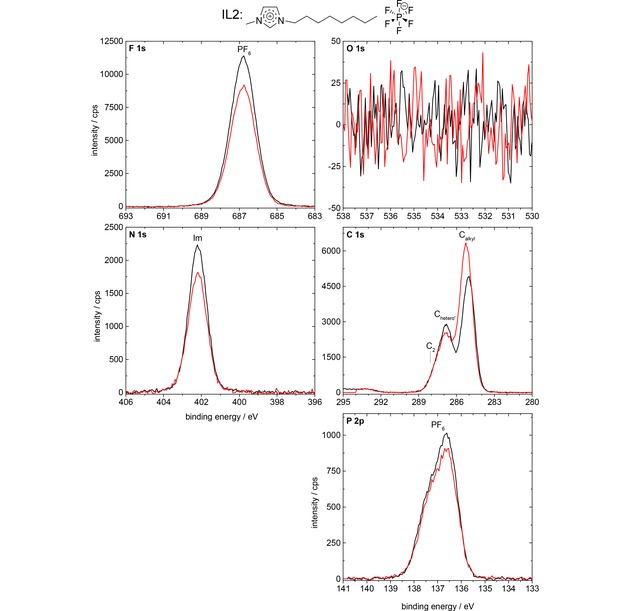
F 1s, O 1s, N 1s, C 1s, and P 2p spectra of IL2, [C8C1Im][PF6], in 0° (black) and 80° (red) emission, measured with Al Kα radiation.
Official websites use .gov
A
.gov website belongs to an official
government organization in the United States.
Secure .gov websites use HTTPS
A lock (
) or https:// means you've safely
connected to the .gov website. Share sensitive
information only on official, secure websites.
F 1s, O 1s, N 1s, C 1s, and P 2p spectra of IL2, [C8C1Im][PF6], in 0° (black) and 80° (red) emission, measured with Al Kα radiation.