Figure 5.

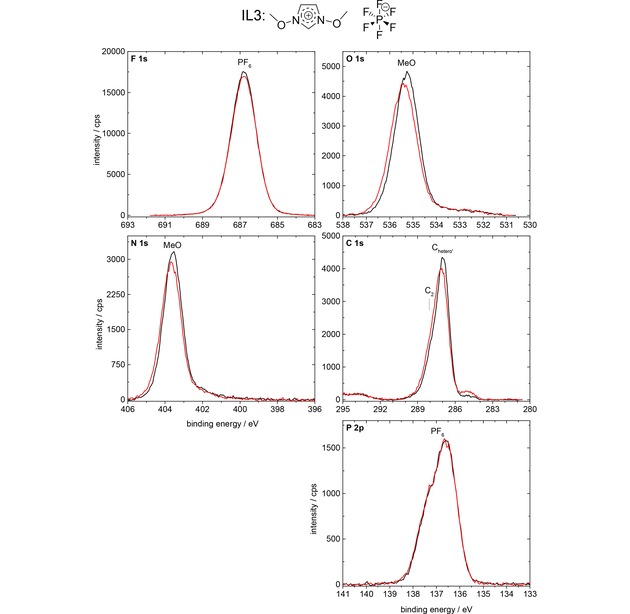
F 1s, O 1s, N 1s, C 1s, and P 2p spectra of IL3, [(MeO)2Im][PF6], in 0° (black) and 80° (red) emission, measured with Al Kα radiation.

F 1s, O 1s, N 1s, C 1s, and P 2p spectra of IL3, [(MeO)2Im][PF6], in 0° (black) and 80° (red) emission, measured with Al Kα radiation.