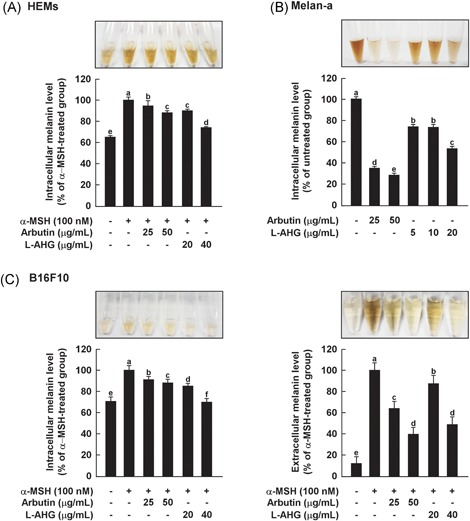
Figure 2.

Effects of l‐AHG on melanin production in various melanin‐producing cells, including HEMs. (A), melan‐a cells (B) and B16F10 cells (C). The cells were pretreated with samples at the indicated concentrations for 1 hour before being exposed to α‐MSH (100 nM) for the indicated times. The melanin levels were determined as described in the Materials and Methods. All data (n = 3) represent the mean values ± SD. Means with letters (a‐f) in a graph are significantly different from each other at P < .05. α‐MSH, alpha‐melanocyte‐stimulating hormone; HEMs, human epidermal melanocytes; l‐AHG, 3,6‐anhydro‐l‐galactose; SD, standard deviation
