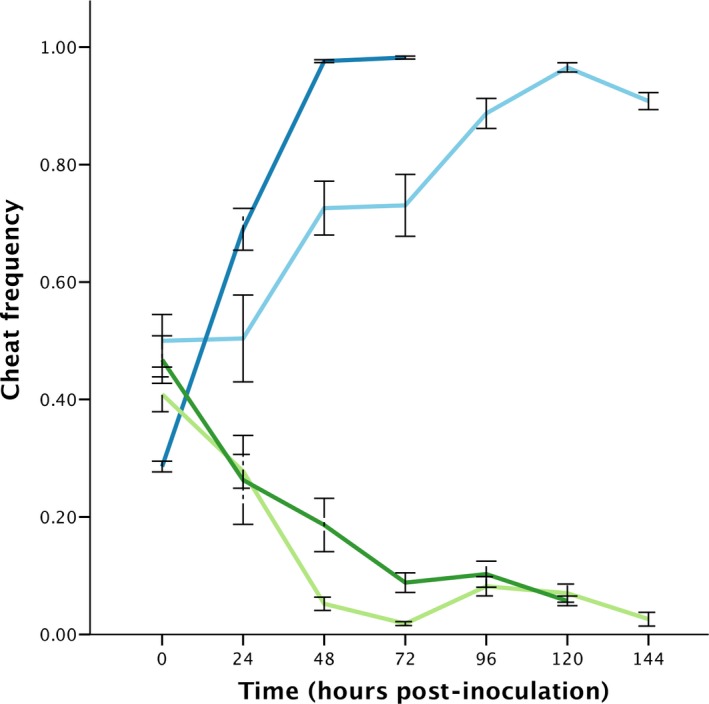
Figure 1.

Cheat frequency over time. Cheats dominate the population in the presence of the homologous cooperator from which they were derived (blues) and are eliminated from the population when in competition with a heterologous cooperator (greens). Light blue and light green show 59.20 cheat in the presence of 59.20 cooperator and PA01 cooperator, respectively. Dark blue and dark green show PA01 cheat in the presence of PA01 cooperator and 59.20 cooperator, respectively. Error bars show mean ± SEM.
