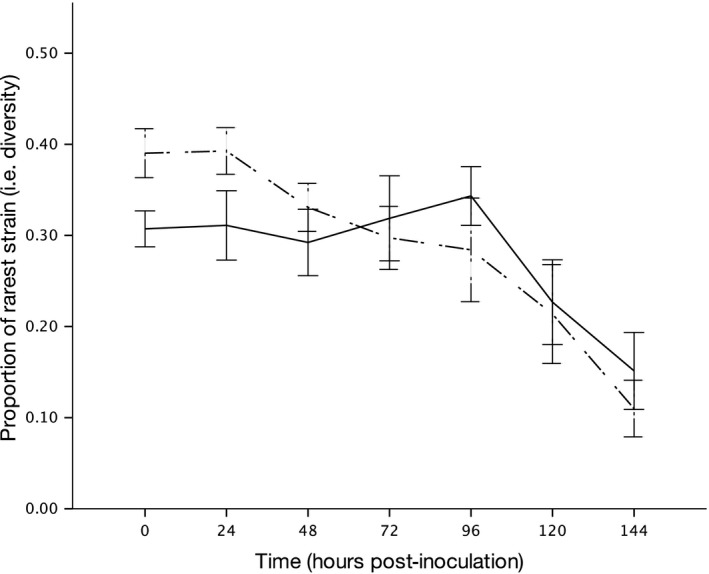
Figure 3.

Mean proportion of rarest strain. Cooperators and cheats of the same strain type in the ‘With Cheat’ treatments were summed, and the proportions of each strain were calculated for both treatments. The proportion of the rarest strain in each replicate was taken as a crude measure of diversity. Dashed line represents populations without cheats, and solid line represents populations with cheats. Error bars show mean ± SEM.
