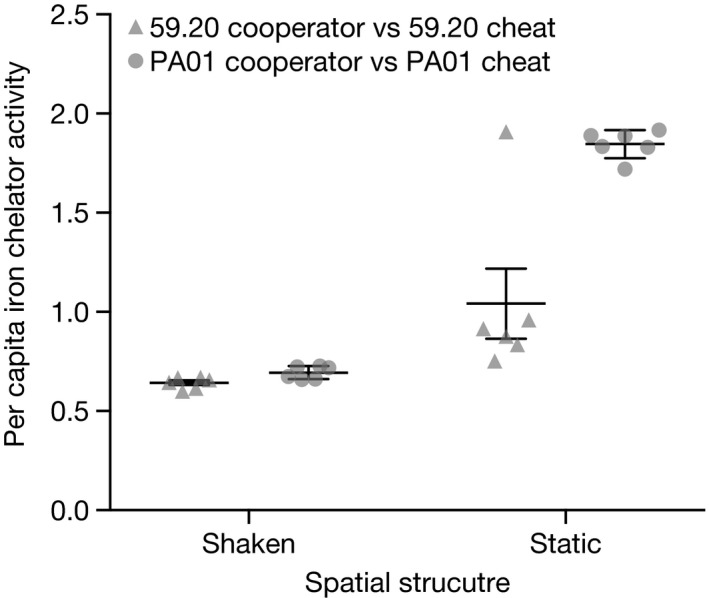
Figure 6.

Per capita iron chelator activity of populations from competitions between cooperators and their respective cheats in shaken and static compost microcosms, taken at the final time point. Data points show the average of two technical replicates. Error bars show mean ± SEM.
