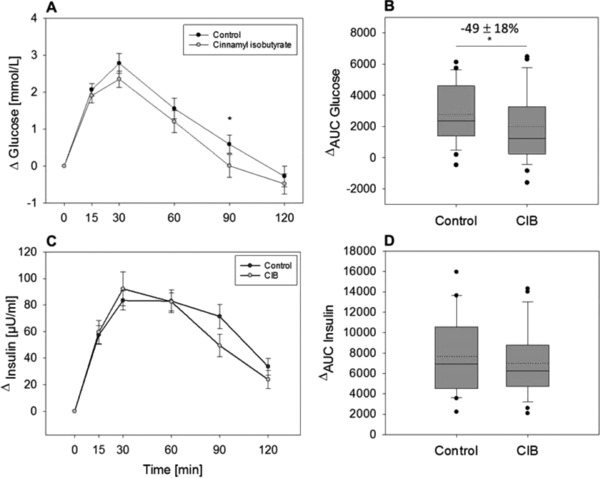
Figure 3.

A) Mean Δ plasma glucose concentrations and B) AUC values as well as C) mean Δ plasma insulin concentration D) AUC values before and 15, 30, 60, 90, and 120 min after an OGTT with or without (control) 0.45 mg cinnamyl isobutyrate (CIB) supplementation (n = 25–26). Values are demonstrated as mean ± SEM. For statistical analysis, a two‐way repeated measures ANOVA for time and treatment (A,C) was performed. Significant differences (p < 0.05) between control and intervention treatments for each time point are marked with “*”. To assess the difference between AUC values (B,D), a paired Student's t‐test (one or two tailed) was performed (*p ≤ 0.05). Mean is presented as dotted line.
