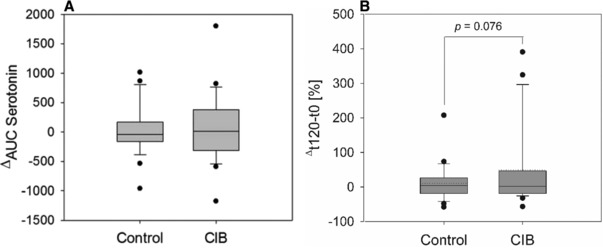
Figure 5.

A) Mean ΔAUC values for serotonin concentrations from baseline levels 15, 30, 60, 90, and 120 min after administration of 75 g glucose without (control) and with supplementation of 0.45 mg cinnamyl isobutyrate (CIB) and B) percentage changes of plasma serotonin levels from fasting to t120 (n = 26). Values are shown as mean ± SEM. Statistical difference (p ≤ 0.05) was determined by a paired Students t‐test (one tailed). Mean is presented as a dotted line.
