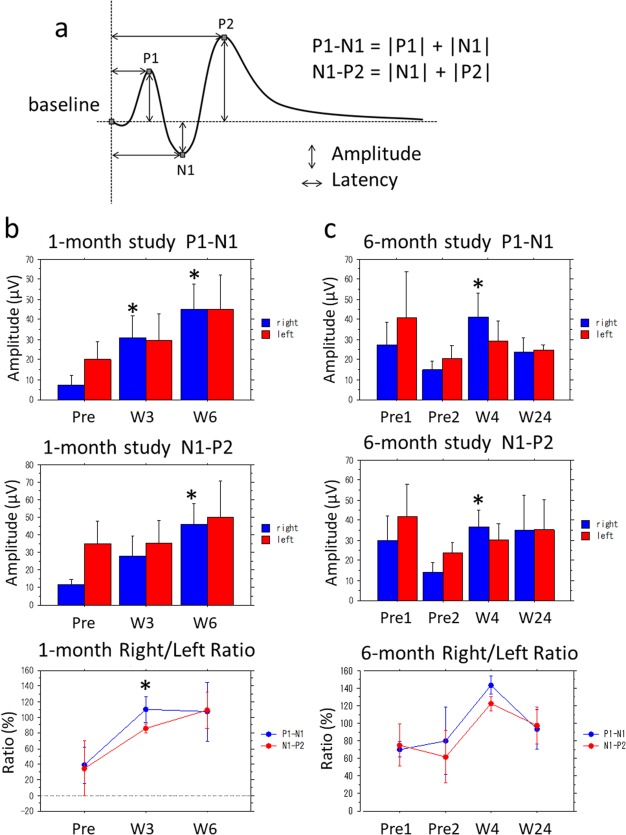
Figure 7.

Statistical analyses of visual evoked potential amplitudes. (a) The definition of amplitude P1‐N1 and N1‐P2, indicating the sum of first positive peak (P1) amplitude and first negative peak (N1) amplitude, and the sum of N1 amplitude and second positive peak (P2) amplitude, respectively. (b) P1‐N1, N1‐P2 amplitudes, and percent ratio of right eye/left eye amplitude in 4 monkeys with 1‐month dye‐coupled film implantation. (c) P1‐N1, N1‐P2 amplitudes, and percent ratio of right eye/left eye amplitude in 3 monkeys with 6‐month dye‐coupled film implantation. Reduced amplitudes (Pre in 1‐month study and Pre 2 in 6‐month study) in the right eyes by macular degeneration become larger after film implantation (*P < 0.05, paired t‐test). The left eyes had no intervention and served as controls. Note that amplitudes (Pre 2) are reduced by the development of macular degeneration, compared with amplitudes (Pre 1) before the induction of macular degeneration in 6‐month study. The right eye/left eye ratios for P1‐N1 and N1‐P2 amplitudes in 1‐month study and 6‐month study (bottom graphs) change significantly in the time course of 1 month and 6 months, respectively (P = 0.0002 and P < 0.0001, repeat‐measure analysis of variance, ANOVA).
