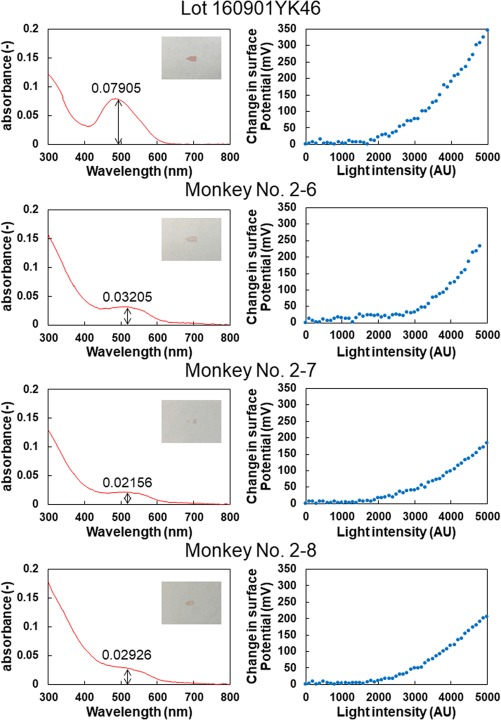
Figure 8.

Spectrophotometric absorbance (left column) and surface electric potential changes of the dye‐coupled films in response to increase in light intensity, measured with scanning Kelvin Probe (right column). Top row to bottom rows, measurements of the same nonimplanted lot, the 5‐month implanted films removed from the eyes of 3 monkeys (No. 2–6, 2–7, and 2–8).
