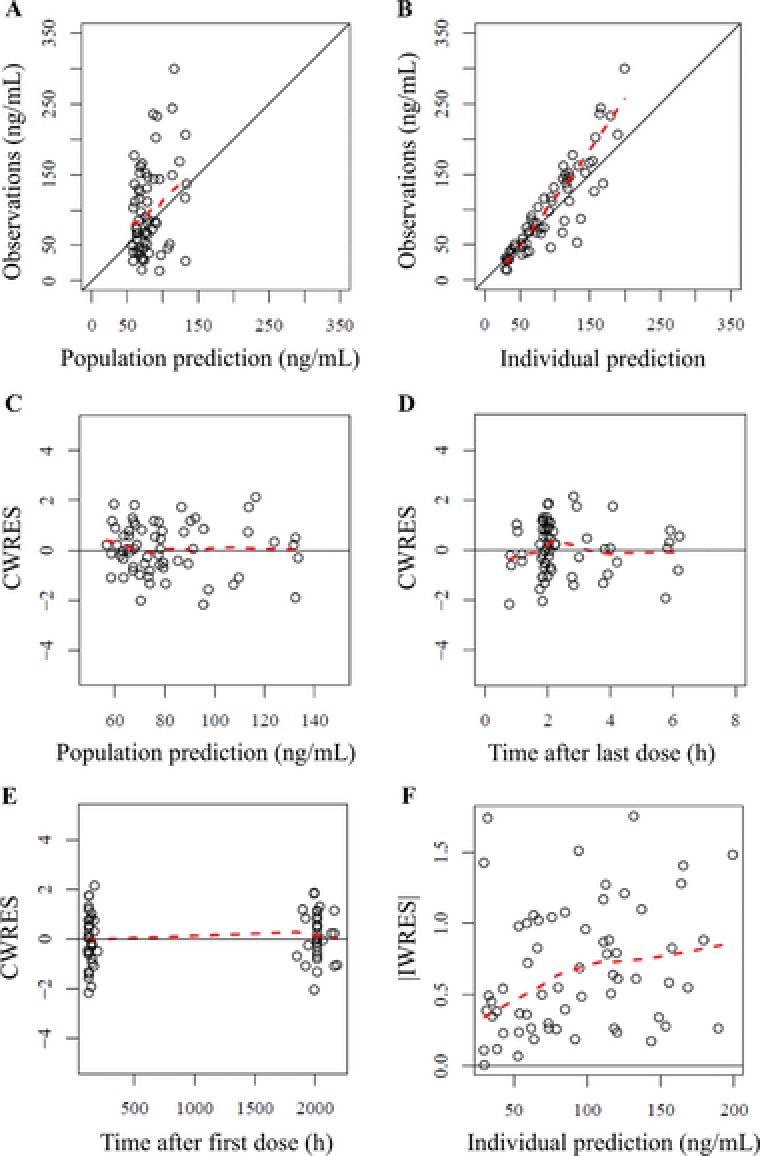
Figure 1.

Goodness‐of‐fit plots of the final population pharmacokinetics model. A, Population prediction (PRED) vs observations. B, Individual predictions (IPRED) vs observations. C, PRED vs conditional weighted residuals (CWRES). D, Time after the last dose vs CWRES. E, Time after the first dose vs CWRES. F, IPRED vs absolute individual weighted residuals (|IWRES|). Population predictions were performed using population mean parameters. Individual predictions were obtained using individual empirical Bayesian estimated parameters. The solid black lines represent the lines of identity (A and B) and y = 0 (C, D, and E). The dashed red lines represent lowess curves.
