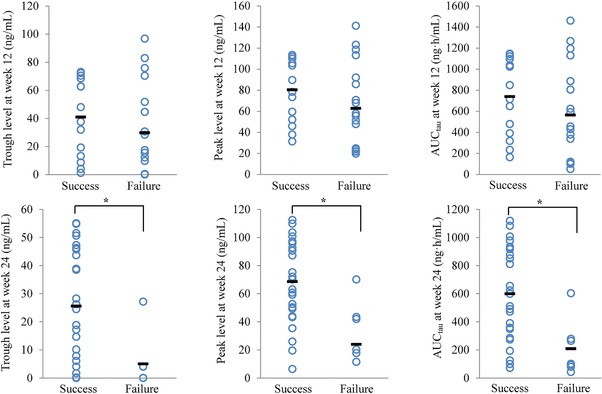
Figure 3.

Relationship between exposure and efficacy determinations at weeks 12 and 24. Trough, peak, and area under the concentration‐time curve (AUCtau) were obtained from individual empirical Bayesian estimated parameters, based on the final population pharmacokinetics model. The horizontal bar for each group is the mean value. Statistical comparisons were performed using the Mann‐Whitney U test (* P < .05).
