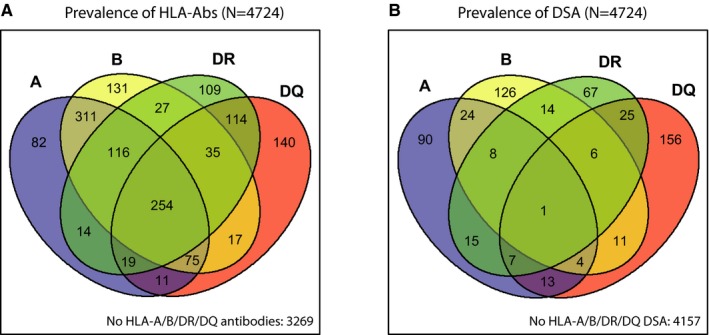
Figure 1.

Prevalence of pretransplant HLA‐Abs and donor‐specific HLA antibodies (DSAs) in the total cohort (N = 4724). A. Venn diagram showing the prevalence of pretransplant HLA‐A/B/DR/DQ HLA‐Abs. B. Venn diagram showing the prevalence of pretransplant HLA‐A/B/DR/DQDSAs [Color figure can be viewed at http://www.wileyonlinelibrary.com]
