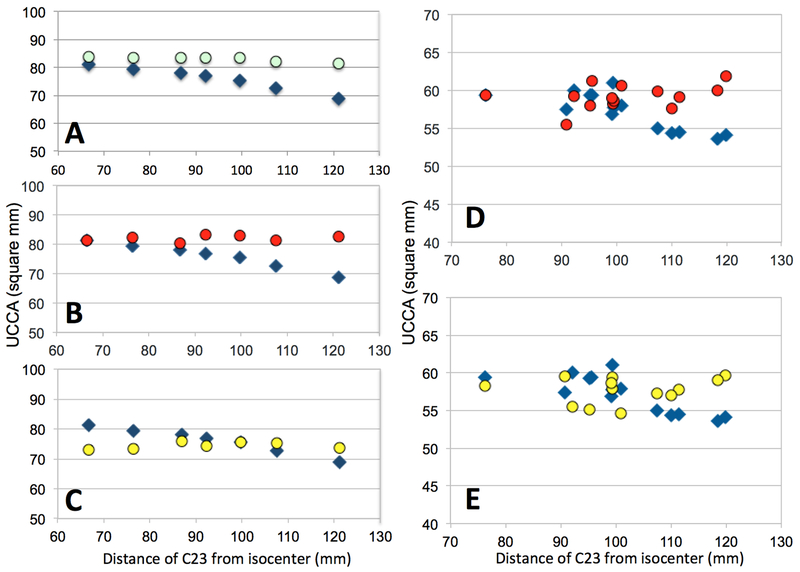
Figure 4.
UCCA as a function of the distance of the C2–3 disc from scanner isocenter: uncorrected data (blue diamonds), retrospectively corrected using the fit of phantom data (emerald circles), normalized using C2 vertebral body diameters (red circles) and normalized using the Jacobian determinant (yellow circles). A, B, C: Healthy control scanned at one site; D, E: multiple sclerosis patient scanned at the 7 NAIMS sites.

