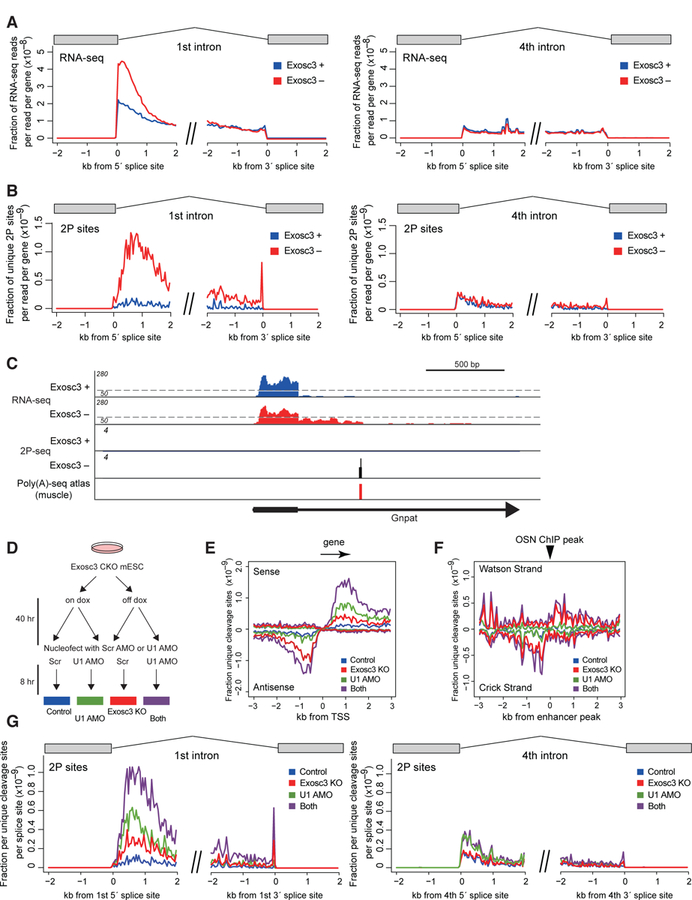
Figure 2. Premature PAS termination in the first intron of sense transcripts.

(A, B) Mean exon-removed RNA-seq signal (A) and unique cleavage sites (2P-seq) with canonical PAS motifs (B) flanking 5´ or 3´ splice sites of the first or fourth intron, normalized by library depth.
(C) Genome browser shot of Gnpat. For RNA-seq, scale changes at a dotted line. Previously reported PAS site in mouse tissues (Derti et al., 2012) is also shown.
(D) Experimental design for double treatment with Exosc3 depletion and U1 inhibition.
(E-G) Mean unique cleavage site signal (2P-seq) with PAS motifs around TSS (E), around OSN ChIP-seq peaks (F), and around the first or fourth 5´ and 3´ splice sites (G) after Exosc3 depletion and/or U1 inhibition.
See also Figure S3.
