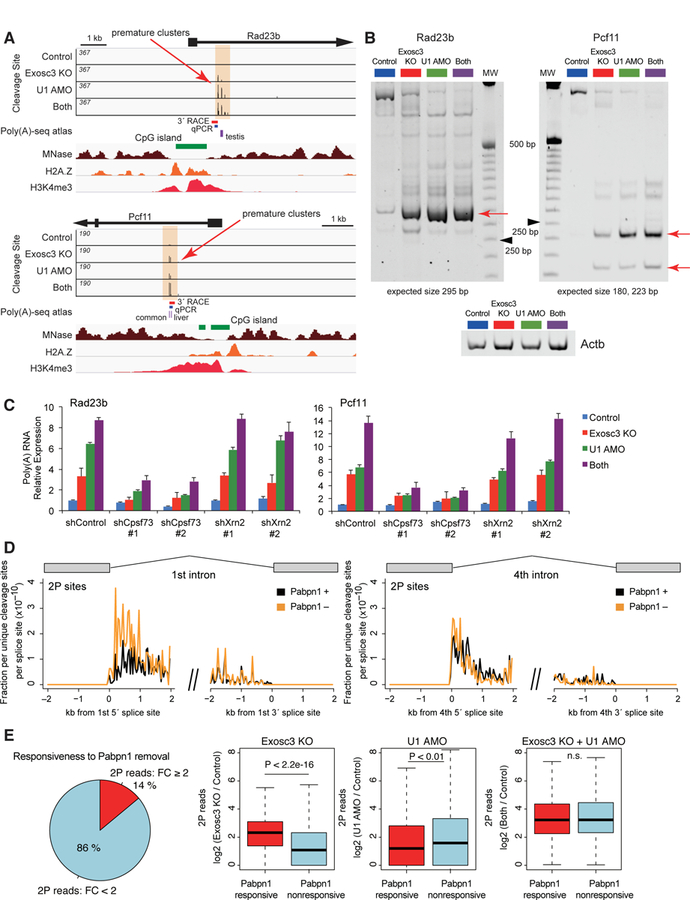
Figure 3. Roles of CPA factor and Papbn1 in premature PAS termination.

(A) Genome browser shot of Rad23b and Pcf11 showing 2P sites (top, orange shade), CpG island (green), MNase-seq (brown), H2A.Z ChIP-seq (orange), and H3K4me3 ChIP-seq (red). Previously reported PAS sites in mouse tissues (purple) and PCR products are also shown.
(B) Nested 3´ RACE analysis of premature termination events, Rad23b and Pcf11, on a nondenaturing polyacrylamide gel. Red arrows indicate the most frequent termination sites, which have been sequence validated. Ladder is 25 bp ladder, and black arrowheads indicate 250 bp. Actb is the loading control.
(C) Effects of knockdown of Cpsf73 or Xrn2 on induction of premature polyadenylated transcripts, determined by qRT-PCR using the fusion primer covering gene-specific sequence and poly(A) tail.
(D) Mean unique cleavage site signal (2P-seq) with PAS motifs around 5´ or 3´ splice sites of the first or fourth intron after Pabpn1 depletion, normalized by library depth.
(E) A relationship between the responses of 2P clusters upon Pabpn1 depletion, Exosc3 depletion, and U1 inhibition. The left pie chart shows percentage of Exosc3- or U1-sensitive 2P clusters sensitive (FC ≥ 2) or non-sensitive (FC < 2) to Pabpn1 removal. Right box plots show read changes in Pabpn1-responsive and Pabpn1-nonresponsive 2P clusters upon Exosc3 depletion, U1 inhibition, or both treatment.
See also Figures S4 and S5.
