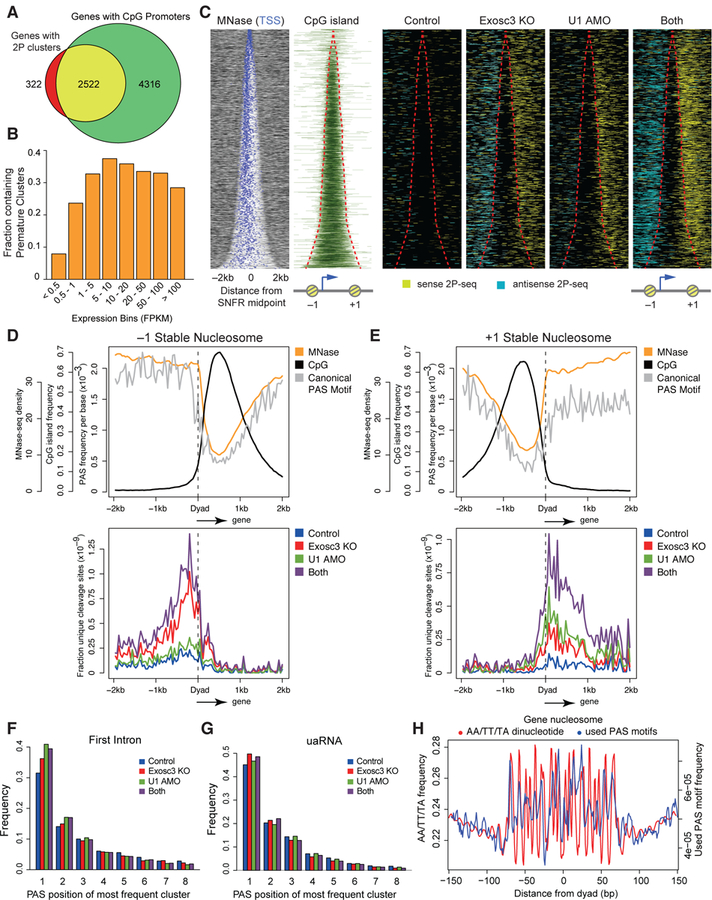
Figure 4. Premature PAS termination around +1/–1 stable nucleosomes demarcated by CpG islands.

(A) Venn diagram demonstrating significant overlap of expressed genes with 2P clusters (FPKM > 0.5) and genes with promoters overlapping with annotated CpG islands.
(B) Fraction of genes with detectable premature cleavage events in different expression bins.
(C) Heatmap of MNase-seq, CpG islands, and PAS-linked cleavage sites (yellow: sense 2P-seq reads, light blue: antisense 2P-seq reads) around the SNFR midpoint for non-overlapping expressed genes with 2P clusters, ranked by increasing SNFR width. Red lines indicate SNFR edges.
(D, E) Metaplots of MNase-seq, CpG islands, and predicted canonical PAS motifs (top) and PAS-linked cleavage sites (bottom) around the dyad axis of the –1 (D) and +1 (E) stable nucleosome.
(F, G) Frequency of PAS position of the most frequently used cluster with AATAAA and ATTAAA motif at the first intron (F) and at defined uaRNAs (G).
(H) AA/TT/TA dinucleotide frequency (red) and frequency of unique used PAS motifs from cleavage clusters (blue) per gene body nucleosome in a 150 bp window from chemical mapping-defined dyad axis. Gene body nucleosomes are between TSS and 2kb upstream from the transcription end site (TES) of genes.
See also Figure S5.
