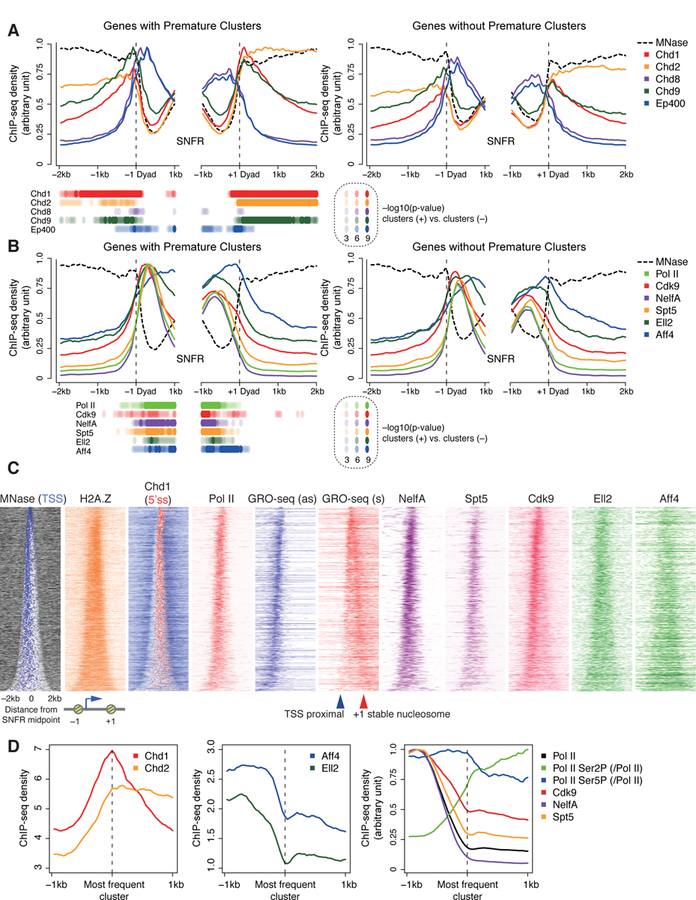
Figure 5. Active chromatin remodeling at +1 stable nucleosome of genes with PAS termination.

(A, B) Read coverage of MNase-seq and MNase digestion-coupled ChIP-seq of various chromatin remodelers (A) and ChIP-seq for Pol II and various pausing and elongation factors (B) around the –1 and + 1 stable nucleosome dyad axis, separated for genes with premature intron clusters (left) and expression-matched genes without premature intron clusters (right). P values with K-S test at each bin are displayed.
(C) Heatmap of MNase-seq, GRO-seq, and ChIP-seq, as in Figure 4C.
(D) Metaplots of Chd1, Chd2, SEC components, and other factors around the most frequent PAS-linked 2P clusters.
ChIP-seq and GRO-seq datasets are from (de Dieuleveult et al., 2016; Jonkers et al., 2014; Lin et al., 2011; Rahl et al., 2010; Seila et al., 2008; Whyte et al., 2013).
See also Figure S6.
