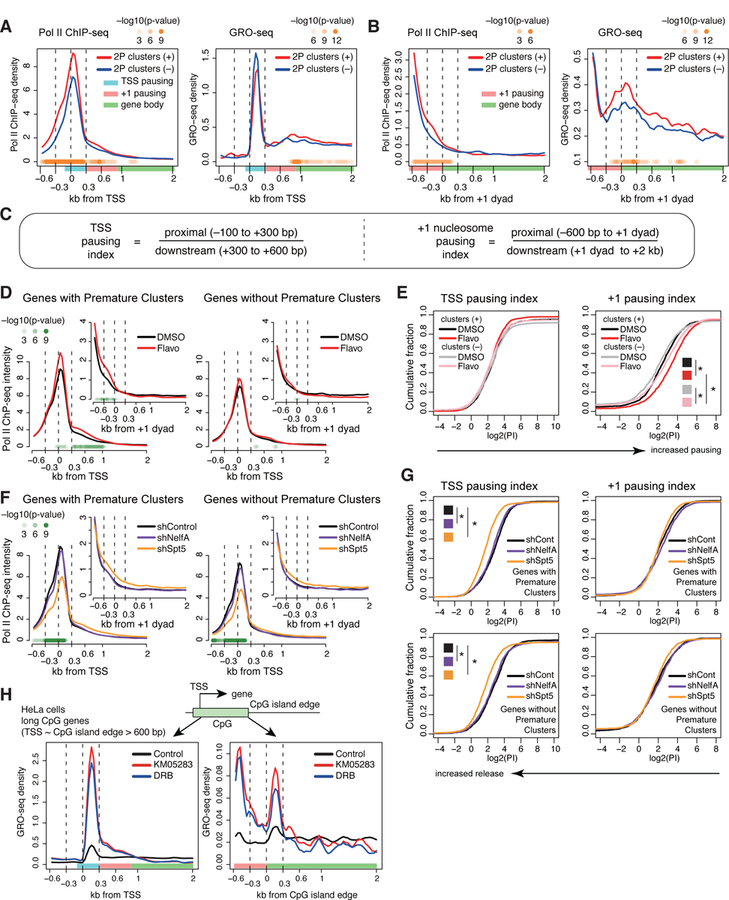
Figure 6. PAS termination and +1 stable nucleosome-associated Pol II pause regulation.

(A, B) Metaplots of mean Pol II ChIP-seq (left) or GRO-seq (right) read density around the TSS (A) or the +1 dyad (B) for wide SNFR genes with 2P clusters (red) and expression-matched wide SNFR genes without 2P clusters (blue). Wide SNFR: distance between TSS and +1 stable nucleosome dyad > 600 bps. P values with K-S test at each bin are displayed in panels (A), (B), (D), and (F, shSpt5 vs. shControl).
(C) Formulas for the two pausing indices.
(D) Metaplots of Pol II ChIP-seq density around the TSS or +1 dyad (inset) of wide SNFR genes with DMSO or flavopiridol treatment.
(E) Cumulative distribution plot of log2(pausing index) of the TSS proximal (left) and +1 stable nucleosome pause (right) for wide SNFR genes with 2P clusters and expression-matched wide SNFR genes without 2P clusters under DMSO or flavopiridol treatment. * P < 0.01 with K-S test.
(F) Metaplots of Pol II ChIP-seq density around the TSS or +1 dyad (inset) in shControl, shSpt5, and shNelfA mESCs.
(G) Cumulative distribution plot of log2(pausing index) of the TSS or +1 stable nucleosome pause for genes with 2P clusters (top) and genes without 2P clusters (bottom) in shControl, shSpt5, and shNelfA mESCs. * P < 0.01 with K-S test.
(H) Metaplots of GRO-seq density around the TSS and edges of CpG islands with KM05283 and DRB treatment in human HeLa cells. Long CpG island genes (distance between TSS and the edge of CpG island > 600 bps) were analyzed.
ChIP-seq and GRO-seq datasets are from (Jonkers et al., 2014; Laitem et al., 2015; Rahl et al., 2010; Seila et al., 2008). See STAR Methods for statistical tests. See also Figure S7.
