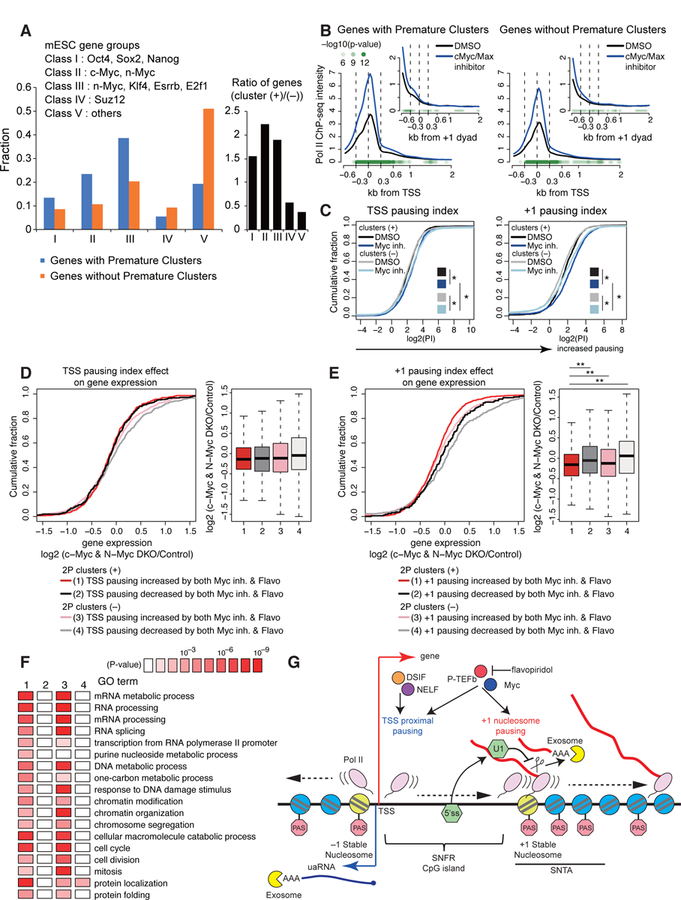
Figure 7. Myc regulates genes with PAS termination and +1 stable nucleosome Pol II pause.

(A) Fraction of mESC gene groups for genes with premature intronic clusters (blue) or without premature intronic clusters (orange). Bar graph in black represents fold change.
(B, C) Metaplots of Pol II ChIP-seq density around the TSS or +1 dyad (B) and cumulative distribution plot of log2(pausing index) of the TSS proximal or +1 stable nucleosome pause (C) for wide SNFR genes with or without 2P clusters upon treatment with DMSO or Myc inhibitor, as shown in Figures 6D and 6E. ChIP-seq datasets are from (Rahl et al., 2010). See STAR Methods for statistical tests. * P < 0.01 with K-S test.
(D) Effects of TSS pause on Myc-dependent gene regulation. Cumulative distribution of log2 fold change of RNA expression in c-Myc and N-Myc double knockout (DKO) mESC is shown for wide SNFR genes with/without PAS termination and flavopiridol/Myc-sensitive TSS pausing.
(E) Cumulative distribution plot is shown as in panel (D) using +1 stable nucleosome pausing indices. ** P < 0.001 with K-S test.
(F) Gene ontology terms enriched in each gene sets as defined in panel (E). All expressed genes were analyzed.
(G) Model of +1 stable nucleosome-associated premature PAS termination.
See also Figure S7.
