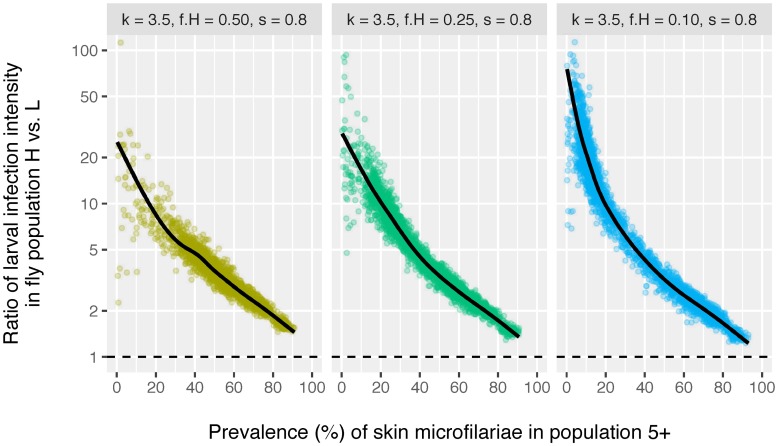
Fig 5. Ratio of larval infection intensity in two spatially separate samples of blackflies around a single community as an indicator of assortative mixing.
Each bullets represents the result of a single simulation. Simulations were run using the same range and values of annual biting rate (ABR) as used in Fig 1, and for each value of ABR 150 repeated simulations were performed. For comparison, a ratio close to 1.0 (horizontal dashed black line) would indicate that flies from two spatially separate samples bite humans with a similar distribution of infection levels (i.e. under the assumption of homogeneous mixing). Lines are based on a generalised additive model with integrated smoothness estimation, fitted to individual bullets.

