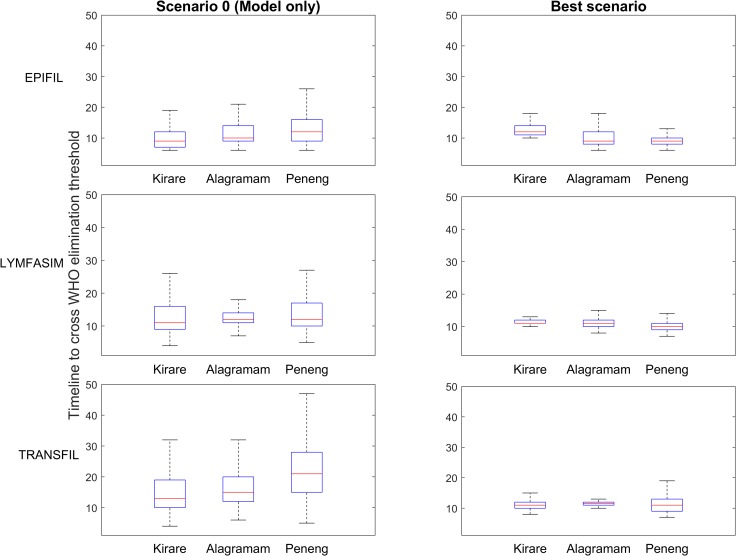
Fig 3. Comparison of model-predicted timelines from model-only simulations and the lowest entropy simulations in each site.
The boxplots show that by calibrating the models to data streams, more precise predictions are able to be made regarding timelines to achieve 1% mf prevalence across all models and sites. The results of pairwise F-tests for variance, performed to compare the weighted variance in timelines to achieve 1% mf prevalence between model-only simulations (scenario 0) and the lowest entropy simulations (best scenario) (see Table 2), show that the predictions for the best scenarios are significantly different from the predictions for the model-only simulations. Significance was determined using the Benjamini-Hochberg procedure for controlling the false discovery rate (q = 0.05). For EPIFIL, LYMFASIM and TRANSFIL, the best scenarios are scenarios 4, 3, and 4 for Kirare, scenarios 4, 4, and 3 for Alagramam, and scenarios 3, 3, and 3 for Peneng, respectively.

