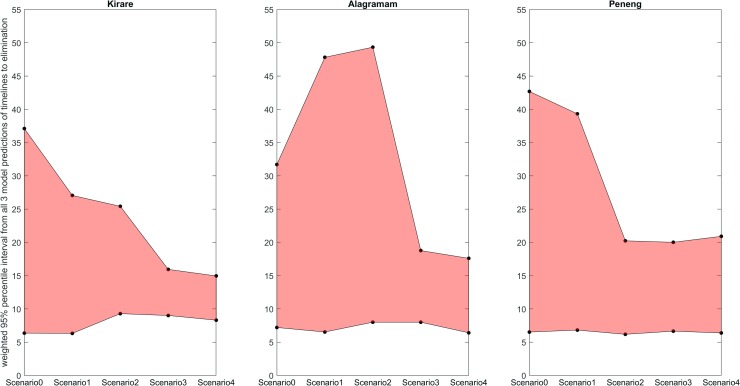
Fig 4. Pooled predictions of the timelines to reach 1% mf from three LF models.
The shaded regions show the weighted 95% percentile interval from the composite predictions of all three models of the timelines required to cross the WHO 1% elimination threshold for all five scenarios. The black dots indicate upper and lower bounds (weighted 2.5th and 97.5th percentiles) of the composite predictions from all three models for each scenario. The range of predictions is tightest when the models were constrained with data from scenarios 3 and 4.

